Current SaaS benchmarks (2025 data, published 2026): median revenue growth about 20%, net revenue retention 101% to 104%, gross revenue retention about 90%, software gross margin 80%, CAC payback 16 months, LTV:CAC 4.1x and Rule of 40 score 25%. Medians vary a lot by company size and contract value, so compare yourself with your own segment.
Key takeaways
- The typical private SaaS company in 2025 grew about 20%, kept about 90% of revenue before expansion and about 101% to 104% after it.
- Software gross margin held at 80% at the median, but AI-heavy products run far lower.
- CAC payback improved to a 16-month median; LTV:CAC rose to 4.1x.
- Only the top quartile cleared the Rule of 40. The median scored 25%.
- Benchmark against companies with a similar contract value and size, not the headline median.
When I wrote Chapter 4 of The Subscription Playbook, I quoted two remarkable numbers.
Snowflake went public with net dollar retention of 158%. JFrog's was 139%.
Those numbers are real. They're also the wrong numbers to judge your own business against. They come from two of the most celebrated IPOs of 2020, and comparing your business with them is like comparing your weekend jog with an Olympic final.
So what does normal look like? What does good look like? And what should you be worried about?
That's what this page is for. I've pulled the latest figures from the biggest benchmark surveys published up to October 2026, and put them in one place. Every number has its source and the year the data covers. Where reports disagree, I show both.
How should you use SaaS benchmarks?
Three rules before you look at a single table.
1. Compare with your segment. SaaS Capital says contract value is the best way to group companies for retention, ahead of age, revenue or industry. A $20-a-month app and a $250,000-a-year platform have almost nothing in common.
2. Medians aren't targets. The median is the middle. Half of companies are below it. Use the top quartile as your goal and the median as your warning light.
3. Mind the data year. Most 2026 reports cover full-year 2025 results. I've labeled each figure with the data year where the source makes it clear.
And one honest caveat: these are mostly surveys of B2B software companies, weighted toward the US. Nobody publishes reliable benchmarks for gyms, cafes or local service subscriptions that I'd stake your decisions on. If that's you, use these tables for direction and your own trend for decisions.
What is a good SaaS growth rate in 2026?
| Segment | Median growth | Top quartile | Source (data year) |
|---|---|---|---|
| All companies | 20% | Aleph and Benchmarkit (2025) | |
| Under $1M ARR | about 100% | 300% | High Alpha (2025) |
| $1M to $5M ARR | about 50% | 100% | High Alpha (2025) |
| $5M to $20M ARR | about 30% | 72% | High Alpha (2025) |
| $20M to $50M ARR | about 30% | 41% | High Alpha (2025) |
| Over $50M ARR | 16% | 29% | High Alpha (2025) |
| Bootstrapped, $3M to $20M ARR | 15% | 42.3% (90th percentile) | SaaS Capital (2026 survey) |
| All bootstrapped vs equity-backed | 20% vs 25% | SaaS Capital (2026 survey) |
AI-native companies are growing much faster. In High Alpha's 2025 data, AI-native startups with $1M to $5M ARR grew at a median 110%, against 40% for traditional B2B SaaS of the same size. At $5M to $20M ARR it was 90% against 30%. If you want to see how the fastest of them price, read the $100M ARR class of 2026.
What is a good net revenue retention rate?
Net revenue retention (NRR) is the book's net dollar retention: revenue from existing customers after churn, downgrades and expansion. Gross revenue retention (GRR) is the same without expansion, so it can't exceed 100%.
| Segment | Median NRR | Median GRR | Source (data year) |
|---|---|---|---|
| Private SaaS, all | about 101% | about 90% | KeyBanc and Sapphire (survey released Oct 2024) |
| ACV $25K to $50K | 102% (top quartile 111%, bottom 97%) | SaaS Capital (2025 survey) | |
| Bootstrapped, $3M to $20M ARR | 103% (90th percentile 117.9%) | 91% (90th percentile 100%) | SaaS Capital (2026 survey) |
| Under $1M ARR | 100% (top quartile 116%) | High Alpha (2025) | |
| $1M to $5M ARR | 104% (top quartile 110%) | High Alpha (2025) | |
| $5M to $20M ARR | 103% (top quartile 115%) | High Alpha (2025) | |
| Over $50M ARR | 101% (top quartile 108%) | High Alpha (2025) | |
| Usage-based pricing models | 108% | Aleph and Benchmarkit (2025) |
SaaS Capital found higher net retention goes with higher contract values, and that companies with NRR of at least 110% grew faster than the survey median. There's a deeper breakdown on the NRR benchmarks page, and churn by industry on the churn benchmarks page.
What is a good gross margin?
| Segment | Median | Other points | Source (data year) |
|---|---|---|---|
| Software revenue | 80% | Top quartile 86%+, bottom quartile 50% | Aleph and Benchmarkit (2025) |
| Total revenue incl. services | 76% | Aleph and Benchmarkit (2025) | |
| Usage-only pricing | 62% | Aleph and Benchmarkit (2025) | |
| Under $1M ARR | 74% | Top quartile 80% | High Alpha (2025) |
| $5M to $20M ARR | 80% | Top quartile 86% | High Alpha (2025) |
| Over $50M ARR | 79% | Top quartile 83% | High Alpha (2025) |
| AI products (average) | 45% | Projected 53% in 2026 | ICONIQ via SaaStr (2025) |
| Fast-growing "Supernova" AI startups | about 25% | "Often negative" | Bessemer (2025) |
| Steadier "Shooting Star" AI startups | about 60% | Bessemer (2025) |
High Alpha also found early-stage gross margins down nearly 10 points year on year, likely from AI costs. If you're building with AI, the gross margin guide shows how to keep model costs from eating your margin.
Benchmark your own numbers
Upload a Stripe subscriptions export and get MRR, churn and cohorts in your browser, then compare them with these tables.
What is a good CAC payback and LTV:CAC?
| Metric | Median | Top quartile | Bottom quartile | Source (data year) |
|---|---|---|---|---|
| CAC payback, all | 16 months (18 in 2024) | 6 months or less | 24 months or more | Aleph and Benchmarkit (2025) |
| CAC payback, ACV under $5K | 11 months | Aleph and Benchmarkit (2025) | ||
| CAC payback, ACV $50K to $100K | 22 months | Aleph and Benchmarkit (2025) | ||
| CAC payback, under $1M ARR | 5 months | High Alpha (2025) | ||
| CAC payback, $1M to $5M ARR | 8 months | High Alpha (2025) | ||
| CAC payback, $5M to $20M ARR | 14 months | High Alpha (2025) | ||
| CAC payback, $20M to $50M ARR | 20 months | High Alpha (2025) | ||
| LTV:CAC, all | 4.1x | 7.8x | 1.1x | Aleph and Benchmarkit (2025) |
| LTV:CAC, vertical vs horizontal SaaS | 5.6x vs 4.1x | Aleph and Benchmarkit (2025) | ||
| Blended CAC ratio (S&M per $1 of new ARR) | $1.30 | Aleph and Benchmarkit (2025) | ||
| Magic number | 1.37 | Aleph and Benchmarkit (2025) |
The book's rule was that CAC should be a third or less of LTV, the classic 3:1. The 2025 median now sits comfortably above it. For how to calculate each one, see the CAC payback and LTV:CAC ratio pages.
What do efficiency benchmarks look like?
| Metric | Figure | Source (data year) |
|---|---|---|
| Rule of 40, median | 25% (15% in 2024) | Aleph and Benchmarkit (2025) |
| Rule of 40, top quartile | 43% or more | Aleph and Benchmarkit (2025) |
| Rule of 40, $1M to $5M ARR median | 33% | High Alpha (2025) |
| Rule of 40, $5M to $20M ARR median | 20% | High Alpha (2025) |
| Rule of 40, over $50M ARR median | 30% | High Alpha (2025) |
| High NRR and fast payback companies | 71% average growth, 47% Rule of 40 | High Alpha (2025) |
| Low NRR and slow payback companies | 10% average growth, 5% Rule of 40 | High Alpha (2025) |
| Burn multiple scale | Under 1x amazing, 1x to 1.5x great, 1.5x to 2x good, 2x to 3x suspect, over 3x bad | David Sacks (2020) |
| Median monthly cash burn, $1M to $20M ARR | about $175,000 | High Alpha (2025) |
The Rule of 40 and burn multiple pages explain when these matter, and when they don't.
How much do SaaS companies spend?
From SaaS Capital's 2026 survey of more than 1,000 private B2B SaaS companies, as a median percentage of ARR:
| Cost line | Median % of ARR |
|---|---|
| Research and development | 22% |
| Selling | 15% |
| General and administrative | 15% |
| Customer support and success | 9% |
| Marketing | 8% |
| Hosting | 5% |
| Professional services delivery | 5% |
| DevOps | 4% |
| Other cost of goods sold | 3% |
| Total, bootstrapped | 96% |
| Total, equity-backed | 101% |
83% of bootstrapped companies were profitable or within two points of breakeven, against 52% of equity-backed companies.
What are good free-to-paid conversion rates?
| Entry model | Good | Great | Source (data year) |
|---|---|---|---|
| Freemium, self-serve | 3% to 5% | 8% to 12% | ChartMogul (Jan 2026 survey) |
| Free trial, no card | 4% to 6% | 10% to 15% | ChartMogul (Jan 2026 survey) |
| Free trial, card required | 25% to 35% | 50% to 60% | ChartMogul (Jan 2026 survey) |
| Median, all B2B products | 8% | ChartMogul (Jan 2026 survey) | |
| Consumer apps, hard paywall (download to paid, day 35) | 10.7% median | RevenueCat (2026) | |
| Consumer apps, freemium (download to paid, day 35) | 2.1% median | RevenueCat (2026) |
The full breakdown, with conversion per 1,000 visitors, is on the free-to-paid conversion page.
What about valuation?
SaaS Capital's 2025 private valuation analysis put its index of public SaaS companies at 7.0 times run-rate revenue, with predicted private multiples of 4.8x for bootstrapped companies and 5.3x for equity-backed ones. KeyBanc and Sapphire's survey released in October 2024 noted public software trading at about 5x to 6x next-twelve-months revenue, against about 17x in 2021.
Growth, retention and gross margin are the three numbers that move a multiple most. The valuation multiples guide shows how, and the valuation estimator gives you a rough range for your own business.
Free Subscription Profit Review

Australian business owners can book a free 30-minute review with a BPAG Accountants adviser. An honest conversation about:
- whether a subscription model could work for your business
- how recurring revenue could cover your fixed costs each month
- how it could lift what your business is worth
No cost, no obligation. General information only until we understand your situation.
What do these benchmarks mean for you?
Here's how I'd read the whole set.
Retention is the quiet winner. Across every report, high net revenue retention lines up with faster growth and better efficiency. That's the case I made in Chapter 9: net negative churn is the moat "the size of the Atlantic Ocean."
Efficiency recovered by cutting. Rule of 40 and payback improved in 2025 largely because companies spent less. Whether that lasts is an open question.
AI changes the margin math. Software margins held at the median, but AI-heavy products run roughly 20 to 55 points lower. Price AI features so heavy users pay for heavy use.
Now pick the one metric where you're furthest from your segment's median. That's your project for next quarter.
Frequently asked questions
Are there subscription benchmarks for small businesses like gyms and cafes?
Not reliable, published ones that I can cite. The large surveys cover software companies, and mobile apps are covered by RevenueCat. For local subscription businesses, the most honest benchmark is your own history: track churn, LTV and payback every quarter and compare with last year. The formulas on our metric pages work the same way for a gym as for SaaS.
Should I compare myself with the median or the top quartile?
Use the median to check you're not in trouble, and the top quartile as a goal. Being below median on one metric isn't a crisis if you're well above on another. A business with 80% gross retention but very fast payback can still be healthy. Look for the metric where you're furthest behind your segment, and fix that first.
Why do different reports give different numbers for the same metric?
Each survey has a different sample. SaaS Capital surveys more than 1,000 private B2B companies, many of them bootstrapped. High Alpha's respondents skew to venture-backed companies. Aleph and Benchmarkit report full-year actuals. Definitions also differ, such as EBITDA versus free cash flow for the Rule of 40. Compare the trend within one source rather than mixing sources.
How often are these benchmarks updated?
Most of the reports here publish once a year. SaaS Capital surveys in the first quarter and publishes through the year, Aleph and Benchmarkit publish mid-year, High Alpha publishes around November, and ChartMogul and RevenueCat early in the year. We review this page when each new edition comes out and date every figure.
Do these benchmarks apply to Australian SaaS companies?
Mostly, yes, because the metrics are ratios and percentages that don't depend on currency. But the samples are dominated by US companies (69% of High Alpha's 2025 respondents were US-based). Australian buyers and valuations can differ, so if you're raising money or selling, get local advice on how your numbers will be read.
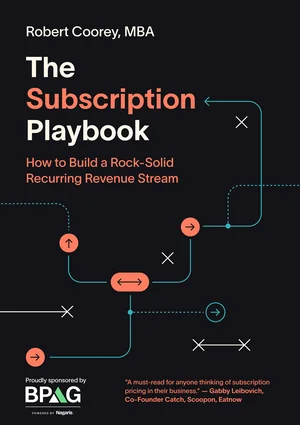
Get both books free
The Subscription Playbook (ebook + audiobook) and Feed a Starving Crowd, instantly. In Australia? Claim the free hardcover.

Robert Coorey, MBA
Robert is the author of The Subscription Playbook and Feed a Starving Crowd and a Director at BPAG Accountants in Sydney. More about Robert.
Sources
- Aleph and Benchmarkit, 2026 SaaS & AI Performance Benchmarks (full-year 2025 data, published 1 June 2026): CAC payback
- Aleph and Benchmarkit, gross margin benchmarks (2025 data)
- Aleph and Benchmarkit, Rule of 40 benchmarks (2025 data)
- Aleph and Benchmarkit, LTV:CAC benchmarks (2025 data)
- High Alpha, 2025 SaaS Benchmarks Report (survey Aug to Sep 2025)
- Kyle Poyar, Growth Unhinged: What's really going on in software (12 Nov 2025)
- SaaS Capital, 2026 Spending Benchmarks for Private B2B SaaS Companies (10 Jun 2026)
- SaaS Capital, 2026 Benchmarking Metrics for Bootstrapped SaaS Companies (24 Apr 2026)
- SaaS Capital, What is a Good Retention Rate for a Private SaaS Company in 2025? (18 Sep 2025)
- KeyBanc Capital Markets and Sapphire Ventures, 15th annual Private SaaS Company Survey (22 Oct 2024)
- SaaS Capital, 2025 Private SaaS Company Valuations
- ChartMogul, The Conversion Report 2026 (4 Feb 2026)
- RevenueCat, The State of Subscription Apps 2026
- Bessemer Venture Partners, The State of AI 2025
- SaaStr, 10 metrics from ICONIQ's 2026 State of AI report (10 Jul 2026)
- David Sacks, The Burn Multiple (23 Apr 2020)
Facts and prices checked 27 October 2026. Spotted something out of date? Tell us.