The key SaaS and subscription metrics are monthly recurring revenue (MRR), annual recurring revenue (ARR), average revenue per user (ARPU), churn, gross and net revenue retention (GRR and NRR), customer lifetime value (LTV), customer acquisition cost (CAC), CAC payback and gross margin. Start with five: MRR, churn, NRR, ARPU and LTV:CAC. Together they show whether you're growing, keeping customers and making money on each one.
Key takeaways
- Track five first: MRR, churn (or GRR), NRR, ARPU and LTV:CAC. Add the rest as you grow.
- Retention drives growth: in SaaS Capital's 2025 data, private B2B SaaS companies with NRR above 130% grew at a median of 50% a year, against 15% below 90%.
- 2025 medians for private B2B SaaS: NRR 101%, GRR 91% (SaaS Capital).
- Every metric breaks if you mix in GST, one-off fees, free users or different time periods.
- AI products need one extra metric: gross margin after inference costs. ICONIQ put the 2025 average at 45%.
We'd put more than $200,000 into my results-guaranteed marketing agency. It was growing. Clients loved the work. But every dollar of revenue was a one-off. We'd win a few projects, max out our capacity, and then the projects would end and I'd sit there wondering how I'd pay everyone.
Feast or famine.
I eventually sold that business and went looking for a model that would let me sleep at night. I found it in subscriptions.
Here's what I learned along the way. A subscription business doesn't just give you predictable revenue. It gives you predictable numbers. You can see next month coming. You can tell whether customers are staying, whether they're spending more, and what each one is worth.
But only if you measure the right things, in the right way.
This guide covers every subscription and SaaS metric that matters, the five to start with, the latest sourced benchmarks, and the mistakes that make good businesses look bad (and bad ones look good).
What are the key SaaS metrics?
Here's the full set, grouped by the question each one answers. Each links to its own page with a worked example and benchmarks.
| Metric | The question it answers | Formula in one line |
|---|---|---|
| MRR | How much recurring revenue do we have each month? | Sum of each subscriber's monthly charge |
| ARR | What's our recurring revenue worth over a year? | MRR × 12 |
| ARPU | What's a typical customer worth per month? | MRR ÷ paying subscribers |
| Churn rate | How many customers (or dollars) are we losing? | Lost ÷ starting, for the period |
| GRR | How much revenue do we keep before upsells? | (Start − contraction − churn) ÷ start |
| NRR | Are existing customers growing with us? | (Start + expansion − contraction − churn) ÷ start |
| Expansion revenue | How much extra are existing customers spending? | Sum of MRR increases from existing customers |
| LTV | What's a customer worth over their lifetime? | ARPU × gross margin ÷ churn rate |
| CAC | What does it cost to win a customer? | Sales and marketing spend ÷ new customers |
| LTV:CAC | Is acquiring customers profitable? | LTV ÷ CAC |
| CAC payback | How long until a new customer pays back? | CAC ÷ (ARPU × gross margin) |
| Gross margin | How much of each dollar is left after delivery costs? | (Revenue − cost of goods sold) ÷ revenue |
| Rule of 40 | Are we balancing growth and profit? | Growth % + profit margin % |
| Burn multiple | How efficiently are we spending to grow? | Net burn ÷ net new ARR |
| Free-to-paid conversion | How many free users become paying customers? | New paying ÷ free or trial users |
That's 15. You don't need all of them on day one.
If you only track five metrics, track these
This is my opinionated shortlist. It works for a SaaS start-up and a suburban gym alike.
- MRR. Your heartbeat. If it isn't rising most months, nothing else matters yet.
- Churn (or GRR). Your leak. In Chapter 9 I called churn "one of the biggest killers of subscription businesses." Watch it monthly.
- NRR. Your engine. Are the customers who stay spending more?
- ARPU. Your price lever. The fastest way to grow revenue without more customers.
- LTV:CAC (or CAC payback). Your sanity check. Are you paying more to win customers than they're worth?
In Chapter 7 I gave a similar list for checking whether land and expand is working: MRR, annual contract value, revenue growth rate, lifetime value, annual renewal rate and CAC, plus a less tangible one, "stickiness." Different names, same idea. Revenue, retention, unit economics.
Stripe Export AnalyserUpload a Stripe subscriptions CSV and get MRR, churn and cohorts in your browser.Open the free tool →Revenue metrics: MRR, ARR and ARPU
Monthly recurring revenue
MRR is the predictable subscription revenue you expect every month. You normalize every plan to a monthly figure: annual price ÷ 12, weekly price × 52 ÷ 12.
MRR = Sum of each active subscriber's monthly recurring charge
Leave out one-off fees, unpredictable usage, GST and free trials. Then track the five movements every month:
Net new MRR = New + Expansion + Reactivation − Contraction − Churn
I learned the importance of "recurring" the hard way. As a telecoms sales manager, I watched a government client's bill explode during an election month, then fall off a cliff. Great revenue. Not recurring.
Annual recurring revenue
ARR is MRR × 12, or the annualized value of your recurring contracts. It's the number buyers and investors talk in.
Be careful with 2026's ARR headlines. Our research into the companies that crossed roughly $100 million ARR this year found most milestones were self-reported run rates, and at least one (Arena) said outright its revenue was consumption-based and "not recurring."
Average revenue per user
ARPU is MRR divided by paying customers. It's the bridge between your price and your growth.
In Chapter 3 I shared Jason Lemkin's math: at $10 a month you need about a million subscribers to reach $120 million a year. Double the price and you need half the customers. Xero is a live example. In FY2026 its subscribers grew 11 percent but average revenue per customer grew 23 percent.
Retention metrics: churn, GRR, NRR and expansion
This is where subscription businesses are won and lost.
Churn rate
Churn is the share of customers (logo churn) or revenue (revenue churn) you lose in a period. Always say which you mean. Ten small customers leaving can be a disaster for logo churn and a rounding error for revenue churn.
Gross revenue retention
GRR is the revenue you keep from existing customers after downgrades and cancellations, ignoring upgrades. It can't exceed 100 percent.
SaaS Capital's 2025 survey of more than 1,000 private B2B SaaS companies found a median GRR of 91 percent, and said you need at least 90 percent to have "a shot at performance parity with your peers."
Net revenue retention
NRR starts with GRR and adds expansion revenue. Above 100 percent means existing customers are growing revenue on their own. The 2025 SaaS Capital median was 101 percent.
This is the metric I called "the miracle of net dollar retention" in Chapter 4. And it's the one most closely tied to growth:
| NRR (SaaS Capital, 2025) | Median annual growth |
|---|---|
| Below 90% | 15% |
| 100%–110% | 21% |
| 120%–130% | 38% |
| Above 130% | 50% |
Benchmarks vary enormously by price point and segment. ChartMogul's 2025 billing data put the B2B SaaS median at 82 percent and consumer SaaS at 49 percent. The full picture is on the NRR benchmarks page.
Expansion revenue and net negative churn
Expansion revenue is the extra money existing customers add through upgrades, add-ons, seats, usage and price rises. When it outweighs churn and downgrades, you have net negative churn, the goal I set in Chapter 9.
NRR − GRR = Expansion ÷ Starting revenue
That gap is your expansion rate. In ChartMogul's 2023 report, 37.1 percent of new ARR at companies with $15 million to $30 million in ARR came from expansion.
NRR and GRR CalculatorNet and gross revenue retention.Open the free tool →Get your core metrics from a Stripe export
Upload a Stripe subscriptions CSV and the free Stripe Export Analyser calculates MRR, churn and cohorts in your browser.
Unit economics: LTV, CAC, payback and gross margin
Revenue and retention tell you whether you're growing. Unit economics tell you whether growth is making you money.
Lifetime value and acquisition cost
LTV = ARPU × Gross margin % ÷ Monthly churn rate
CAC = Total sales and marketing spend ÷ New customers acquired
In Chapter 7 I suggested you want CAC to be a third or less of LTV. That's an LTV:CAC ratio of 3:1 or better.
CAC payback
CAC payback (months) = CAC ÷ (ARPU × Gross margin %)
Bessemer's portfolio data (2010 to 2021) suggested targets of under 12 months for SMB-focused companies, under 18 for mid-market and under 24 for enterprise. A gym or cafe should aim for far faster, because consumer subscribers churn faster.
Gross margin
Gross margin is what's left of each dollar after the direct cost of delivering it. It matters more in 2026 than it has for a decade, because AI changed the cost of delivery.
Traditional SaaS has long run on high software margins. AI products don't. ICONIQ's 2026 State of AI report, as summarized by SaaStr, put the average AI-product gross margin at 45 percent in 2025, projected to reach 53 percent in 2026. Bessemer found its fastest-growing AI "Supernovas" averaged about 25 percent, "often negative."
If you sell anything with AI inside, model it before you price it.
AI Gross Margin CalculatorModel token costs, heavy users and margin for an AI product.Open the free tool →Efficiency metrics: Rule of 40 and burn multiple
These matter mainly if you've raised money or plan to.
- Rule of 40: revenue growth rate plus profit margin should be 40 or more. A business growing 30 percent with a 10 percent margin scores 40.
- Burn multiple: net cash burned divided by net new ARR. It tells you how many dollars you spend to add a dollar of recurring revenue. Lower is better.
A bootstrapped cafe club doesn't need either. A venture-backed SaaS company will be asked for both.
Funnel metrics: free-to-paid conversion
If you run freemium or free trials, track how many free users become paying ones. In Chapter 3 I noted that the average freemium conversion rate sits between 2 and 5 percent, which is why freemium needs a big addressable market.
How the metrics fit together
Metrics aren't a list. They're a chain.
- Price sets ARPU.
- ARPU × customers gives MRR, and MRR × 12 gives ARR.
- Churn and expansion determine GRR and NRR.
- ARPU, gross margin and churn determine LTV.
- LTV ÷ CAC tells you whether growth is profitable.
- NRR, growth and margin drive valuation.
Pull any lever and the others move. Raise prices and ARPU rises, LTV rises, payback shortens, but churn may tick up. Cut churn and LTV rises, NRR rises, and every acquisition dollar works harder.
This is why I'd rather see five metrics tracked honestly every month than 30 tracked occasionally.
The 2026 benchmark cheat sheet
Every figure here is sourced and dated. For the full compiled set, see the subscription benchmarks page.
| Metric | Benchmark | Source and year |
|---|---|---|
| NRR, private B2B SaaS median | 101% | SaaS Capital, 2025 |
| GRR, private B2B SaaS median | 91% | SaaS Capital, 2025 |
| NRR, B2B SaaS median (billing data) | 82% (upper quartile 97%) | ChartMogul, 2025 |
| NRR, B2C SaaS median | 49% | ChartMogul, 2025 |
| NRR, AI-native median | 48% | ChartMogul, 2025 |
| GRR, AI-native under $50 a month | 23% | ChartMogul, 2025 |
| Annual vs monthly plans | Annual median NRR 10–20 points higher | ChartMogul, 2025 |
| Median growth, private B2B SaaS over $1M ARR | 24% | SaaS Capital, 2025 |
| Private SaaS ARR growth | 15% in 2024, expected 20% in 2025 | KeyBanc and Sapphire Ventures, Nov 2025 |
| AI product gross margin, average | 45% in 2025, 53% projected for 2026 | ICONIQ via SaaStr, 2026 |
| CAC payback targets | SMB under 12, mid-market under 18, enterprise under 24 months | Bessemer, portfolio data 2010–2021 |
| LTV:CAC | CAC a third or less of LTV | The Subscription Playbook, Ch 7 |
Which metrics matter for a gym, a cafe or an accounting firm?
Most metric guides are written for venture-backed software companies. Most subscription businesses aren't. Here's how I'd adapt them.
| Business | Track monthly | Watch out for |
|---|---|---|
| Gym or fitness studio | MRR (weekly billing × 52 ÷ 12), member churn, pauses, ARPU by plan | Joining fees inflating "revenue"; frozen memberships hiding churn |
| Cafe coffee club | Members, MRR, redemptions per member, churn | Heavy users eroding margin on "unlimited" plans |
| Accounting or bookkeeping firm | MRR from fixed-fee packages, GRR, expansion (payroll, advisory add-ons) | One-off jobs mixed into recurring revenue |
| Trades maintenance plans | Active plans, renewal rate, ARPU, extra work sold to plan holders | Counting a plan as active after it lapses |
| Subscription box | MRR, churn by cohort month, skips, gross margin after shipping | Discounted first boxes making CAC look cheap |
| SaaS or AI product | All five core metrics, plus gross margin after hosting and inference | Usage spikes counted as ARR |
The gym's "frozen membership" trap deserves a mention. In Chapter 1 I noted that about 80 percent of people who sign up for a gym membership cancel within six months. If you let members freeze instead of cancel, that's fine, but count frozen members separately or your churn rate will lie to you.
Steal this: the one-page monthly metrics sheet
Every month, on one page, write down: starting MRR, new MRR, expansion MRR, contraction MRR, churned MRR, ending MRR, paying customers, ARPU, and one sentence on why the biggest customer who left, left. It takes 30 minutes. It will teach you more about your business than any dashboard you don't open.
Seven mistakes that break subscription metrics
- Including GST. In Australia, GST is collected for the ATO. It adds 10 percent to every revenue figure if you leave it in.
- Counting one-off fees as recurring. Joining fees, setup fees and hardware make MRR look bigger than it is.
- Counting free users. Trials and free tiers have an ARPU of zero. Keep them out of revenue metrics and track them in your funnel.
- Mixing periods. A monthly churn rate compared with an annual benchmark is meaningless. A monthly NRR of 101 percent compounds to about 112.7 percent a year.
- Counting the full price of an upgrade. A customer moving from $20 to $50 is $30 of expansion.
- Averaging away the story. Blended metrics hide segments. Split by plan, customer size and billing period.
- Confusing MRR with cash and revenue. Annual prepayments bring cash in early. Under AASB 15, that revenue is recognized over the term. Three numbers, three purposes.
How to build a metrics dashboard in an afternoon
In Chapter 9 I told the story of Box, the cloud storage company. It was using Salesforce to identify "churn events," but struggled to measure whether its fixes were working. It brought in dashboards that showed product adoption, usage and, crucially, which top clients were at risk of not renewing in the next 90 days.
You don't need enterprise software to do the same.
- Export your customer list. One row per customer: start date, plan, monthly price excluding GST, status, cancellation date.
- Calculate the five core metrics. MRR, churn, NRR, ARPU and LTV:CAC. Our free calculators do each one, or the Stripe Export Analyser does several at once.
- Pick one leading indicator. Something that predicts churn before it happens: logins, visits, redemptions, support tickets.
- Set a monthly review. Same day, same metrics, same definitions.
- Write the definitions down. What counts as churned, when a past-due card becomes a cancellation, how you treat pauses. Consistency beats precision.
Why metrics matter when you come to sell
Recurring revenue is valuable because it's predictable. Metrics are how a buyer checks that prediction.
When a buyer or investor looks at a subscription business, they're usually asking four questions. How much recurring revenue is there? Is it growing? Will it stay? Does each customer make money? That's ARR, growth, retention and unit economics.
Clean, consistently defined metrics make that conversation easier, and they're far cheaper to set up now than to reconstruct during due diligence.
Free Subscription Profit Review

Australian business owners can book a free 30-minute review with a BPAG Accountants adviser. An honest conversation about:
- whether a subscription model could work for your business
- how recurring revenue could cover your fixed costs each month
- how it could lift what your business is worth
No cost, no obligation. General information only until we understand your situation.
What to do next
- Pick your five metrics from the shortlist above.
- Calculate this month's numbers. Start with MRR and net revenue retention.
- Compare them with the benchmarks for your segment, not someone else's.
- Choose one metric to improve this quarter. If churn is high, start there. If churn is fine, work on expansion and ARPU.
- Review monthly. Write down what changed and why.
The goal isn't a beautiful dashboard. It's never again sitting there wondering how you'll pay everyone next month.
More in this section
ARPU
ARPU explained: the formula, monthly vs annual, ARPU vs ARPA vs ARPPU, real 2026 figures from Xero and Dropbox, and five ways to raise it safely.
Annual Recurring Revenue
What annual recurring revenue really means, how to calculate ARR, ARR vs MRR vs run rate, growth benchmarks, and why 2026 ARR headlines need care.
Burn Multiple
What burn multiple is, how to calculate it from net burn and net new ARR, David Sacks' scale from amazing to bad, and how small businesses can use it.
CAC Payback Period
How to calculate CAC payback period, what a good payback is in 2026 (the median is 16 months), and how gyms, cafes and SaaS firms can shorten it.
Customer Acquisition Cost
How to calculate customer acquisition cost honestly, with SaaS and gym examples, 2026 benchmarks from SaaS Capital and Benchmarkit, and fixes for high CAC.
Expansion Revenue
Expansion revenue is extra recurring revenue from existing customers. How to calculate expansion MRR, six ways to earn it, and sourced benchmarks.
Free-to-Paid Conversion
What a good free-to-paid conversion rate is in 2026 for freemium, free trials, card-required trials and apps, how to measure it, and how to lift yours.
SaaS Gross Margin
What a good SaaS gross margin is in 2026 (median 80% on software), what belongs in cost of goods sold, and why AI products and cafe clubs run far lower.
GRR vs NRR
GRR vs NRR explained with one worked example: what each includes, why you need both, 2025 benchmarks side by side, and a simple 2x2 to diagnose your business.
Gross Revenue Retention
Gross revenue retention shows how much revenue you keep before any upsells. The GRR formula, a worked example, 2025 benchmarks and the 90% line to beat.
The LTV
What a good LTV:CAC ratio is in 2026, how to calculate it, why 3:1 is a floor not a goal, and how gyms and cafes can use it. Includes 2025 benchmark data.
Customer Lifetime Value
How to calculate customer lifetime value for a subscription business, with worked SaaS and gym examples, 2026 benchmarks and the mistakes that inflate it.
Monthly Recurring Revenue
How to calculate monthly recurring revenue properly: the MRR formula, what to leave out, net new MRR, a worked gym example and growth benchmarks.
Negative Churn
Net negative churn means existing customers add more revenue than you lose. The formula, a corrected example from the book, benchmarks and tactics.
Net Revenue Retention
What net revenue retention measures, the NRR formula with a worked example, 2025 benchmarks from SaaS Capital and ChartMogul, and mistakes that inflate it.
The Rule of 40
What the Rule of 40 is, how to calculate it, what real SaaS companies scored in 2025 (median 25%), and when the rule is the wrong yardstick for your business.
Frequently asked questions
What is the single most important SaaS metric?
If I had to pick one, it would be net revenue retention, because it combines churn, downgrades and expansion into a single number that predicts growth. But one metric is never enough on its own. A business with great NRR and terrible customer acquisition economics can still run out of cash, so pair it with LTV:CAC or CAC payback.
How often should I review subscription metrics?
MRR, new sign-ups and cancellations: monthly at least, weekly if you're early or running a campaign. Retention, LTV and CAC: monthly, judged on a rolling 12-month view, because single months are noisy. Benchmarks and valuation multiples: once or twice a year. The rhythm matters more than the tool. A 30-minute monthly review beats a dashboard nobody opens.
Do I need special software to track SaaS metrics?
Not to start. A spreadsheet with one row per customer, their plan, start date, current monthly price and cancellation date gives you MRR, churn, ARPU and retention. Billing platforms like Stripe and analytics tools like ChartMogul or Baremetrics automate it once you have more customers. Our free Stripe Export Analyser works from a CSV in your browser.
Are SaaS metrics different from subscription metrics?
The core is the same: recurring revenue, retention and unit economics. SaaS adds software-specific measures such as seat counts, usage, product activation and gross margin after hosting or AI costs. Consumer and local subscriptions lean more on member counts, visit frequency and pause rates. Use the shared core, then add the few that fit your model.
What metrics do buyers look at when I sell a subscription business?
Buyers usually start with ARR and its growth rate, then gross and net revenue retention, gross margin, customer concentration and the cost of acquiring customers. In Chapter 5 of the book I suggest no single client should be more than 10% of revenue and your top five no more than 25%. Clean, consistently defined metrics also make due diligence faster.
What are vanity metrics in a subscription business?
Numbers that look good but don't tell you whether the business is healthier: total sign-ups including free users, social followers, website visits, or gross bookings that include one-off sales. They're not useless, but they don't predict revenue. If a metric can rise while MRR, retention and margin all fall, treat it as a vanity metric.
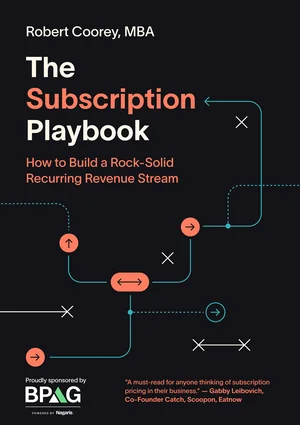
Get both books free
The Subscription Playbook (ebook + audiobook) and Feed a Starving Crowd, instantly. In Australia? Claim the free hardcover.

Robert Coorey, MBA
Robert is the author of The Subscription Playbook and Feed a Starving Crowd and a Director at BPAG Accountants in Sydney. More about Robert.
Sources
- SaaS Capital, 2025 B2B SaaS Retention Benchmarks (Sept 2025)
- ChartMogul, SaaS retention: the AI churn wave (10 Dec 2025)
- ChartMogul, SaaS Retention Report (Nov 2023)
- KeyBanc Capital Markets and Sapphire Ventures, Private SaaS Company Survey press release (13 Nov 2025)
- Bessemer Venture Partners, Scaling to $100 Million (portfolio data 2010–1H21)
- SaaStr summary of ICONIQ's 2026 State of AI report (10 Jul 2026)
- Bessemer Venture Partners, The State of AI 2025 (13 Aug 2025)
- The Subscription Playbook (Robert Coorey, 2022), Chapters 1, 3, 4, 5, 7 and 9
Facts and prices checked 27 October 2026. Spotted something out of date? Tell us.