A good churn rate depends on who you sell to and at what price. Recurly's July 2026 network data puts median churn at 3.22% for SaaS, 3.44% for business services, 4.25% for e-commerce and 4.99% for education, with involuntary churn about 1.25% across all industries. Business software with annual contracts should aim for 90%+ gross revenue retention.
Key takeaways
- Recurly's July 2026 medians range from 3.22% (SaaS) to 4.99% (education), with failed payments behind about a third of churn.
- Private B2B SaaS companies keep a median 91% of revenue a year before upgrades and 101% after (SaaS Capital, 2025).
- Churn falls as price rises: $10 to $25 subscriptions churn more than $100+ ones, mostly because of failed payments.
- Compare yourself with businesses at your price point and contract type, not with an all-industry average.
Here's a number I love.
When I wrote The Subscription Playbook, logistics software company WiseTech had kept annual churn at 1 percent or lower for nine years straight.
Think about what that means. If WiseTech started the year with 100 clients, ignored sales completely and signed up nobody new, it would still have 99 clients in December.
Now compare that with gyms. About 80 percent of people who sign up for a gym membership cancel within six months, and many gyms need several times more paying members than they could ever fit inside at once.
Both are subscription businesses. Both can be profitable. But if a gym owner compared their churn with WiseTech's, they'd have a breakdown.
So when someone asks me "what is a good churn rate?", my answer is always: good compared with whom? Let me give you the numbers, and then show you which ones to compare yourself with.
What is a good churn rate? The short answer
Here's a simple way to read your own number. These bands are my rule of thumb, built from the data below.
| Monthly customer churn | What it usually means |
|---|---|
| Under 1% | Excellent. Typical of embedded B2B software on annual or multi-year contracts |
| 1% to 2% | Strong for most B2B and high-value consumer subscriptions |
| 2% to 4% | Normal for consumer subscriptions and self-serve software |
| 4% to 6% | Worth investigating. You're losing 40% to 50% of customers a year |
| Over 6% | Fix this before spending more on acquisition |
Remember the compounding. 2% a month is about 22% a year. 5% a month is about 46% a year. The formula is on the churn rate page.
Churn benchmarks by industry (2026 data)
The freshest large dataset I can find comes from Recurly, a subscription billing platform, using July 2026 data from businesses on its network.
| Industry | Total churn | Voluntary | Involuntary (failed payments) |
|---|---|---|---|
| SaaS | 3.22% | 2.16% | 1.06% |
| Business and professional services | 3.44% | 2.27% | 1.18% |
| Travel, hospitality and entertainment | 3.91% | 2.63% | 1.28% |
| Digital media and entertainment | 4.14% | 2.55% | 1.59% |
| E-commerce (including boxes) | 4.25% | 2.87% | 1.38% |
| Education | 4.99% | 3.30% | 1.69% |
| All industries | 3.60% | 2.34% | 1.25% |
Source: Recurly network data, July 2026 (medians).
Check the definition before you compare
Recurly's page describes these figures as annual medians. But they sit very close to the monthly churn rates other sources report, such as Antenna's 4.6% average monthly churn for US premium streaming in 2025 and Zoom's 2.9% monthly churn for its self-serve customers. My reading is that they're best compared with monthly churn. Whatever you compare against, make sure the period, the definition and the customer type match yours.
Two things jump out.
First, voluntary churn is the bigger share in every industry. People choosing to leave is still the main problem.
Second, failed payments cause about a third of churn. That's churn your customers never chose, and it's the cheapest kind to fix. See involuntary churn and failed payments.
How does price affect churn?
The more customers pay, the less they churn, at least up to a point. Recurly's July 2026 data by average revenue per customer:
| Price per month | Total churn | Voluntary | Involuntary |
|---|---|---|---|
| $10 to $25 | 4.29% | 2.99% | 1.30% |
| $25 to $50 | 3.84% | 2.73% | 1.11% |
| $50 to $100 | 3.15% | 2.41% | 0.74% |
| $100 to $250 | 2.87% | 2.40% | 0.46% |
| Over $250 | 3.07% | 2.90% | 0.18% |
Look at the involuntary column. It drops 87% from the cheapest band to the most expensive. Higher-value customers tend to use better payment methods and fix failed payments themselves.
The lesson for small businesses: if you sell a $15 subscription, your failed-payment process matters more than almost anything else you do.
Churn Rate CalculatorCustomer and revenue churn, plus what it costs you.Open the free tool →B2B SaaS retention benchmarks
Business software usually reports retention as revenue, not customer counts. SaaS Capital's 2025 survey of more than 1,000 private B2B SaaS companies gives the best private-company picture:
| Annual contract value | Median net revenue retention | Median gross revenue retention |
|---|---|---|
| Under $12,000 | 98% | 90% to 91% |
| $25,000 to $50,000 | 102% | 90% to 91% |
| Over $250,000 | 106% | 95% |
| All companies | 101% | 91% |
A median gross revenue retention of 91% means the typical private SaaS company loses about 9% of its revenue each year to cancellations and downgrades, before counting upgrades. If you want to understand the difference between those two columns, read GRR vs NRR and the NRR benchmarks.
What do real subscription companies report?
Public companies give us churn numbers with names attached. Here's a mix from the book and from 2025 and 2026 company reports.
| Company | Churn or retention figure | When | What it shows |
|---|---|---|---|
| WiseTech (CargoWise) | About 1% annual churn | Nine years to 2021 (as in the book) | Mission-critical, embedded software barely churns |
| TechnologyOne | Under 1% churn (2020); net revenue retention 115% | FY25 | Deep switching costs plus expansion |
| Procore | Gross retention 95%, net retention 106% | Full-year 2025 | Usage pricing tied to customer volume |
| Zoom (self-serve "online" customers) | 2.9% monthly churn | Q4 FY26 | Card-paying, self-serve customers churn like consumers |
| US premium streaming (10 services) | 4.6% average monthly churn | 2025 (Antenna) | Consumers rotate services |
| Netflix | About 2.4% monthly, against 7% for rivals | Q1 2021 (as in the book) | Ongoing usage keeps churn low |
| Peloton | 0.73% monthly (book) to 2.2% | Quarter to June 2026 | Boom-time churn doesn't last |
The Peloton line is the warning. A low churn number measured in your best year isn't a moat. Read how Peloton's churn tripled.
What about gyms, cafes, clinics and other local businesses?
Here's where I have to be honest with you. There are almost no reliable published churn benchmarks for local service subscriptions: gym memberships, coffee clubs, dental plans, car wash clubs, salon memberships.
What we do have:
- Gyms: the book's figure that about 80% of members cancel within six months. That's the extreme end.
- Car washes: Mister Car Wash made 79% of its wash sales from its Unlimited Wash Club in 2025, which tells you members stick around long enough to dominate revenue.
- Vet and dental plans usually run on 12-month terms, so churn happens at renewal. Measure renewal rate, not monthly churn.
My suggestion: for a local membership paid monthly, treat 3% to 5% a month as a sensible first target, and track your own cohorts. "Of the people who joined in January, how many are still paying in April?" is more useful than any industry average.
When churn benchmarks mislead you
Benchmarks are a sanity check, not a target. Four reasons yours might look worse than average and still be fine:
- You're early. New businesses churn more while they learn who their best customer is.
- Your price is low. A $12 plan will churn more than a $120 plan. Compare within your band.
- You've just grown fast. New cohorts churn more than old ones, so a wave of sign-ups pushes your average up for a few months.
- You sell monthly and others sell annual. Annual plans can only churn at renewal. Blended averages flatter them.
And one reason yours might look better than average and still be a problem: you're making it hard to leave. From 1 July 2027 that becomes a legal problem in Australia, not just a reputation one. See cancellation flows that save customers legally.
See what your churn costs you
Plug in your numbers and the free Churn Rate Calculator shows your monthly and annual churn and the revenue you lose each year.
Why churn matters for the value of your business
When I say churn is the number buyers care about, I mean it.
Low churn means revenue is predictable. Predictable revenue is valued as a multiple of revenue. High churn means a buyer is really buying a customer acquisition machine that has to keep running just to stand still, and they price it accordingly.
If you're an Australian business owner thinking about what your subscription revenue is worth, it's worth getting the numbers checked before you plan a sale or a price change.
Free Subscription Profit Review

Australian business owners can book a free 30-minute review with a BPAG Accountants adviser. An honest conversation about:
- whether a subscription model could work for your business
- how recurring revenue could cover your fixed costs each month
- how it could lift what your business is worth
No cost, no obligation. General information only until we understand your situation.
What to do next
- Calculate your churn three ways: customer, revenue and net revenue, for each of the last twelve months.
- Split voluntary from involuntary. If failed payments are more than a third of your churn, fix that first.
- Find your band. Compare yourself with businesses at your price point and contract type, using the tables above.
- Build one cohort chart. Customers by sign-up month, and the share still paying at month 1, 3, 6 and 12.
- Pick the biggest leak and work through the customer retention strategies that target it.
Then run the Churn Risk Checklist to see where your next customers are likely to leave.
Frequently asked questions
Is 5% monthly churn bad?
For most businesses, yes. At 5% a month you lose about 46% of your customers every year, so you have to replace nearly half your base just to stay level. Some low-priced consumer subscriptions live with it because acquisition is cheap. For business software, professional services or any high-touch offer, 5% a month usually signals an onboarding or fit problem worth fixing first.
What churn rate do investors and buyers look for?
Buyers of subscription businesses care less about one month's churn and more about revenue retention over a year. For B2B, gross revenue retention around 90% or better and net revenue retention above 100% are the numbers that support stronger valuation multiples. For consumer subscriptions, they look for stable or improving cohort retention and low involuntary churn.
Why is consumer churn higher than business churn?
Consumers pay smaller amounts, usually monthly, usually by card, and can cancel on a whim. Businesses tend to sign longer contracts, build you into their processes and involve several people in the decision to leave. Consumer subscriptions also suffer more failed payments, which is why involuntary churn falls so sharply as price rises.
What is a good churn rate for a subscription box?
Subscription boxes sit in the e-commerce group, where Recurly's July 2026 median is 4.25%, with 2.87% voluntary and 1.38% involuntary. Boxes built on surprise tend to churn faster than boxes built on replenishment, because novelty fades. Letting members skip a month or choose their items usually keeps more of them than a fixed, auto-shipped box.
How does churn affect the value of my business?
Directly. Lower churn means each customer stays longer, so lifetime value and future revenue are higher and more predictable. Buyers pay revenue multiples for predictable recurring revenue and discount businesses where customers leave fast. Cutting churn is often the quickest way to lift what your business is worth before a sale.
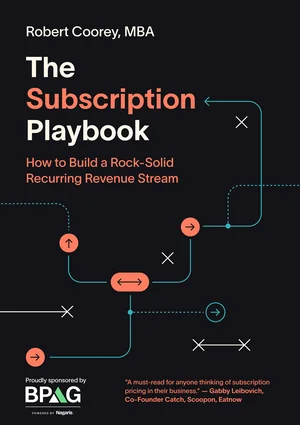
Get both books free
The Subscription Playbook (ebook + audiobook) and Feed a Starving Crowd, instantly. In Australia? Claim the free hardcover.

Robert Coorey, MBA
Robert is the author of The Subscription Playbook and Feed a Starving Crowd and a Director at BPAG Accountants in Sydney. More about Robert.
Sources
- Recurly, Churn rate benchmarks (July 2026 network data)
- SaaS Capital, What is a good retention rate for a private SaaS company in 2025?
- Antenna, State of Subscriptions: Premium SVOD 2025 Year in Review
- Zoom, Q4 and FY2026 results (SEC Exhibit 99.1)
- Peloton, Q4 and FY2026 results
- Procore, Q4 and full-year 2025 results
- TechnologyOne, FY25 full-year results presentation
Facts and prices checked 27 October 2026. Spotted something out of date? Tell us.